SHAPING LIVES, ANCHORING COMMUNITIES

ECONOMIC IMPACT OF PRIVATE, NONPROFIT HIGHER EDUCATION

The contributions of higher education extend far beyond an individual’s degree. Private, nonprofit colleges (like Wartburg) and universities play significant roles in the everyday lives of those living and working in college communities and are important contributors to the nation as a whole. Serving as one of the nation’s primary vehicles for social and economic mobility, private, nonprofit colleges and universities are accelerating economic growth, creating jobs, and boosting the nation’s tax base. 

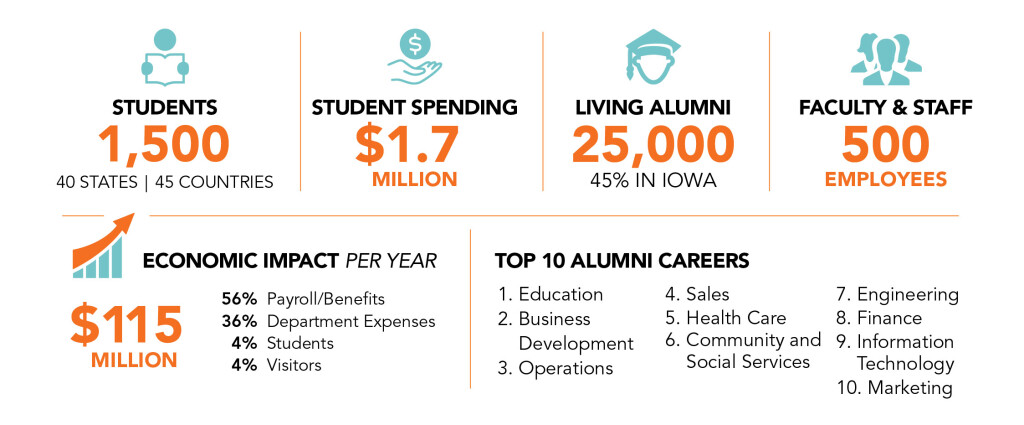
WARTBURG’S 2022-23 LOCAL ECONOMIC IMPACT

Economic Impact 2022-23 Figures - $115 million

PRIVATE, NONPROFIT COLLEGES & UNIVERSITIES
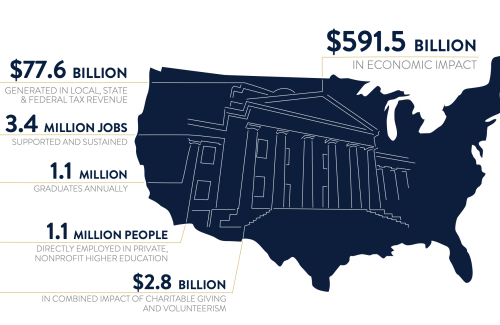
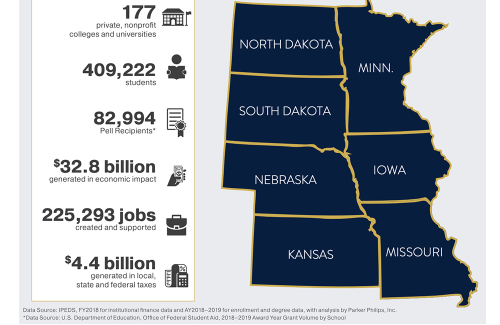
NATIONAL & REGIONAL ECONOMIC IMPACT

Findings from a report released by the National Association of Independent Colleges and Universities (NAICU) are presented below. Data was collected from the 2018-19 academic year and represent all private, nonprofit higher education institutions in the U.S.

The ecosystem of America’s higher education system is uniquely complex. As part of a diverse array of large public land-grant and regional universities, community colleges, and for-profit institutions, the 1,700 private, nonprofit colleges and universities account for nearly 40% of all degree-granting institutions and educate more than 5 million students.

  • Private, Nonprofit
  • Public
  • For Profit

UNDERGRADUATE PERCENTAGE SHARE

  • Private, Nonprofit
  • Public
  • For Profit

MASTER’S PERCENTAGE SHARE

DIVERSE ARRAY OF STUDENTS

Private, nonprofit higher education institutions educate a diverse array of students across demographics and include a wide variety of institutions – research universities, faith-based colleges, Historically Black Colleges and Universities, Minority-Serving Institutions, Tribal Colleges and Universities, art and design colleges, traditional liberal arts colleges and science institutions, women’s colleges, work colleges, and schools of law, medicine, engineering, business and other professions.

African American

Private, Nonprofit - 13%
Public 4-Year - 12%

Women

Private, Nonprofit - 58%
Public 4-Year - 55%

Asian American

Private, Nonprofit - 6%
Public 4-Year - 7%

Pell Grant Recipients

Private, Nonprofit - 38%
Public 4-Year - 40%

Hispanic

Private, Nonprofit - 14%
Public 4-Year - 18%

Bachelor's Degree Completed in Four Years

Private, Nonprofit - 84%
Public 4-Year - 70%